

Deep learning models are often called black boxes, inscrutable to human interpretation. When a deep neural network classifies an image as a cat, it doesn't say that it thinks so because of the fluffy ears or the tail, but rather combines a whole bunch of algebra into a single result - cat or not. The growing field of machine learning interpretability attempts to address this problem by applying various methods to uncover the reasoning behind a network's predictions, which helps the user of the model address failures and apply fixes. This is particularly important in applications that require a human to trust a model, such as in medical imaging. In this post, we will take a brief look at several methods of interpretability.
Roadmap
First, let's plot our course for discussing interpretability. The first major separation of methods is whether the method is model dependent or model independent. Model dependent methods are intrinsic to the model - a simple linear regression intrinsically matches an input variable to an output variable in an easy to interpret manner. Model dependent methods thus cannot be applied to other predictions unless you incorporate that model as an additional layer in your own network.
Model independent methods are not inherent to any particular architecture - they are methods that can be applied more generally and thus are the go to method for looking under the hood of neural networks. These methods can seem less powerful as they are more of a band-aid solution but they are becoming more useful as new research is released.
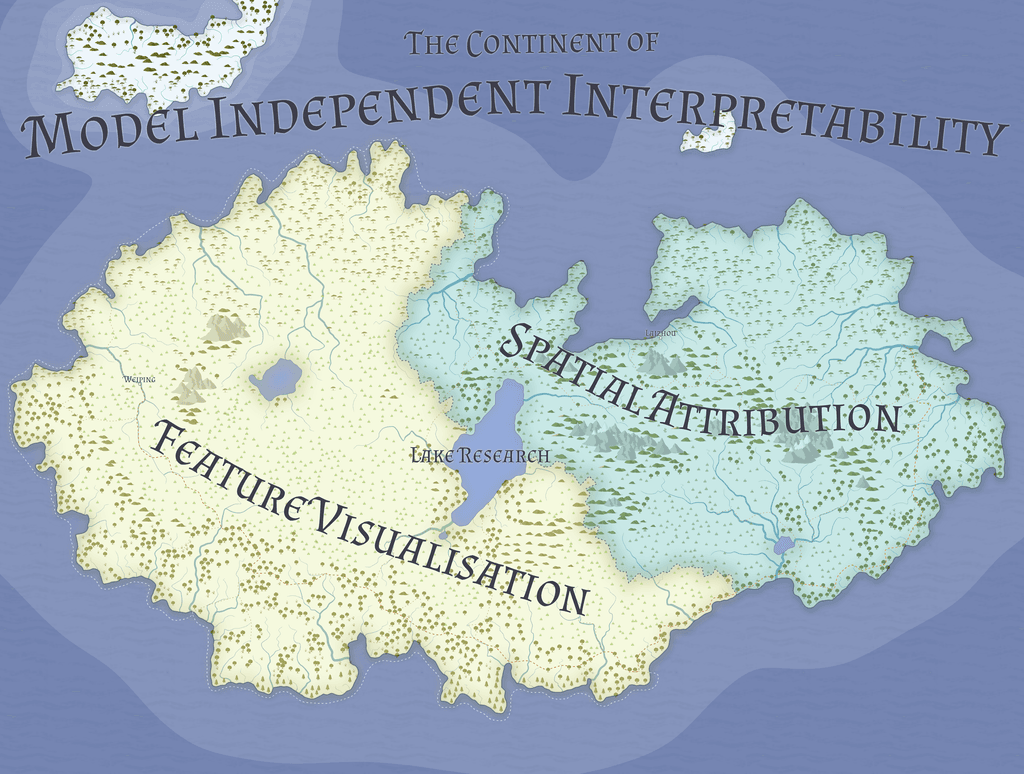
Our roadmap for this post will start in the Continent of Model Independent Interpretability. The two main countries on this continent are Feature Visualisation methods and Spatial Attribution methods. Additionally, there is a catch-all Lake Research, which provides for both populations.
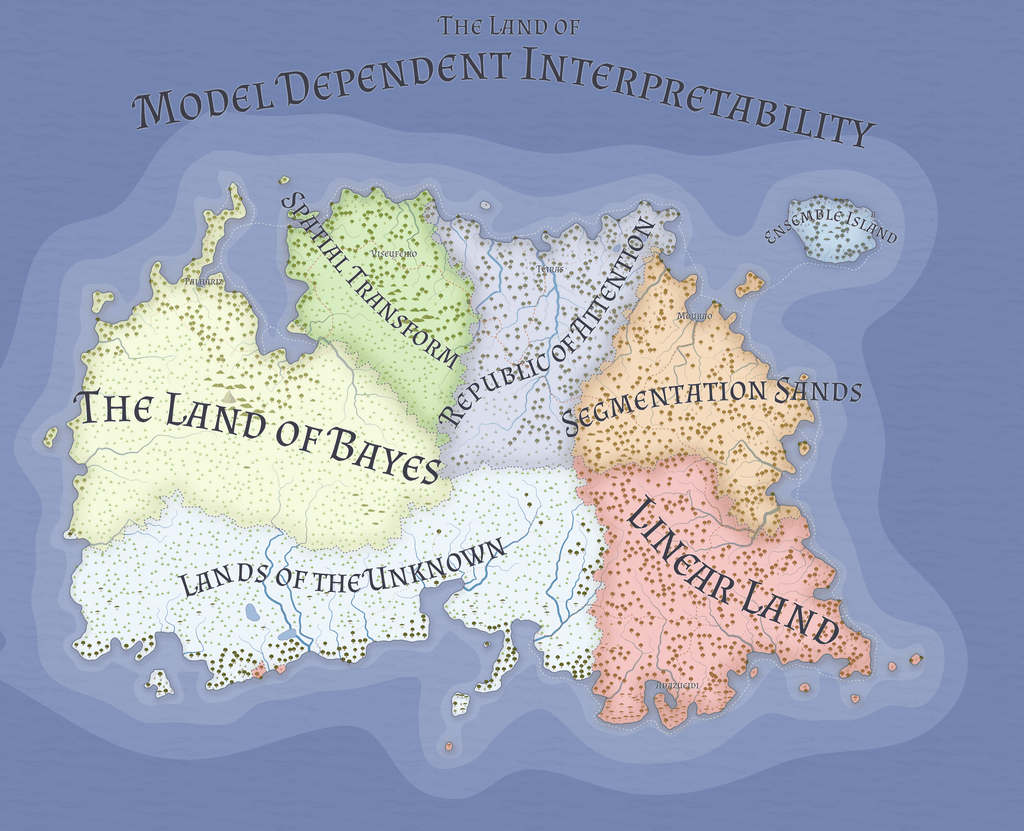
Secondly, we will explore the Land of Model Dependent Interpretability. In this land, the model is used to interpret the prediction directly. The are many different kinds of models and we will explore only a few.
Model Independent Methods
On the Continent of Model Independent Interpretability, all models can be assessed with the same methods. The main split on the continent divides the land into methods which visualise and infer structure from features in the network. The other half infers structure on the input to the network.
Feature Visualization
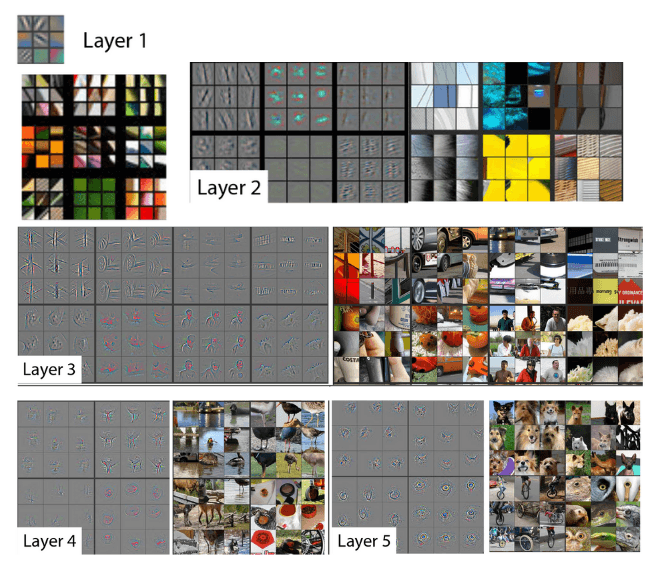
Visualizing the features of a neural network is a popular method for interpretation. Concretely, a sample image is run through the network and at each junction in the network, the weights are extracted and visualised. This visualisation yielded the intuition that convolutional networks build up in pattern complexity from recognizing lines and edges to corners, patterns and eventually parts of the whole object like the ears or tail of a cat1.
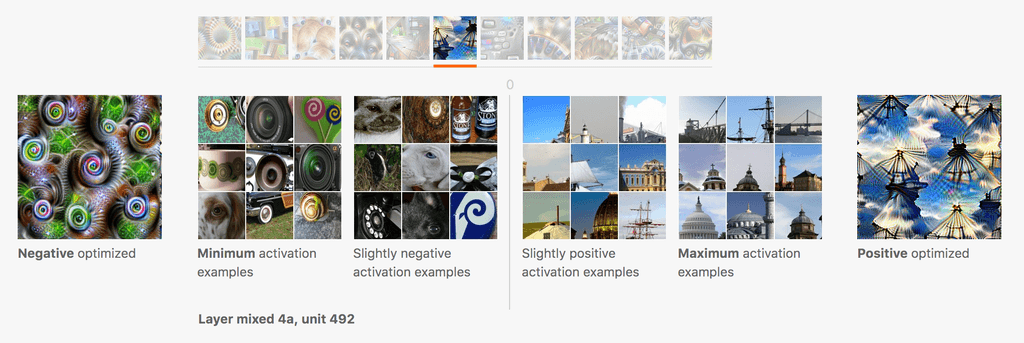
With this basic intuition, we can then take a pretrained network and visualize a neuron's activation by optimizing input noise with respect to an image of a certain class. This results in the dream-like effect of what a highly activated cat class might look like2.
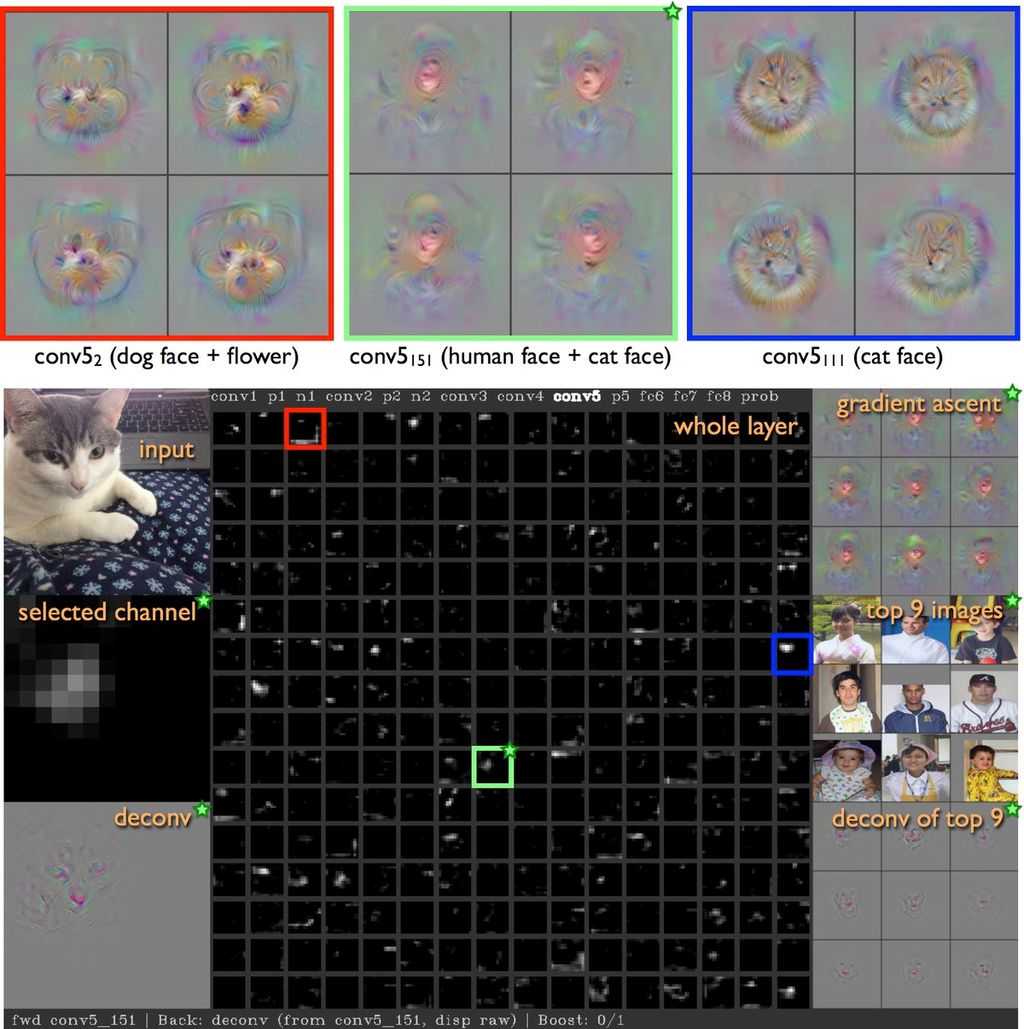
Similarly, we can also look at negative neurons - neurons that detract from the prediction that a cat is a cat, such as if, for example, there was water in the image. Negative neurons are a form of counterfactual reasoning for images and provide similar insight into the decision making process3.
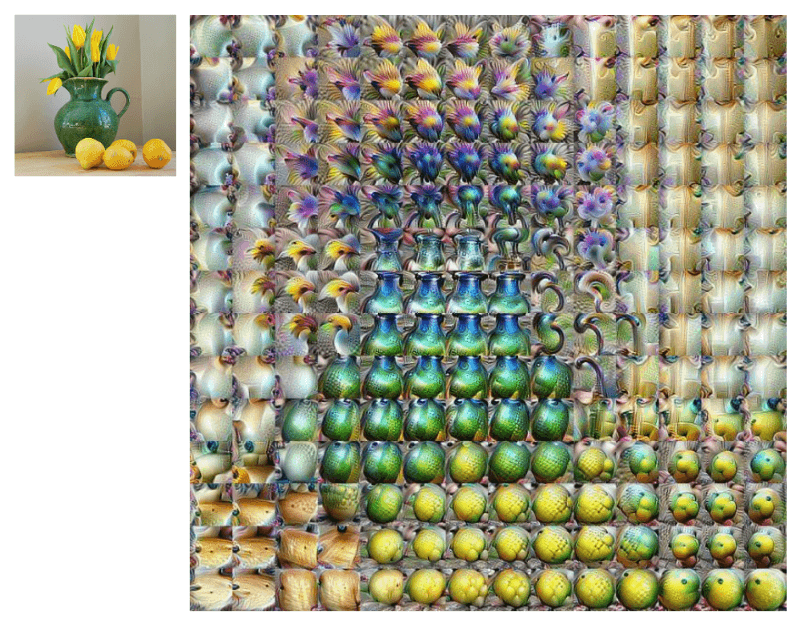
Extending from this idea, we can compute neuron activations across the entire sample image and create a composite image of what the network "sees" at a particular layer. By adjusting the layer of the network, we can see the same increasing complexity as before but now across the entire image4.
Spatial Attribution
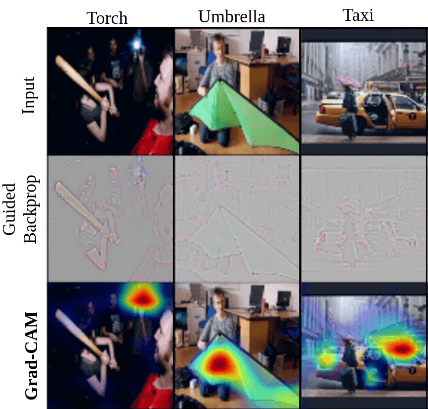
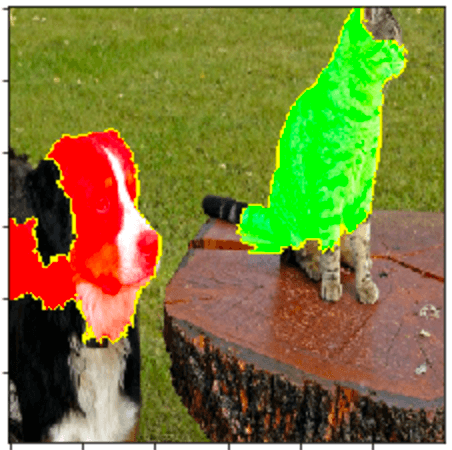
Attributing certainty in a prediction to a location in the input sample is another method of interpretability. Doctors looking at medical images may point to certain characteristic features that indicate a particular ailment. Similarly, we can use various techniques to attribute maximal probability to the prediction. Saliency maps look at the gradient of the input sample with respect to the output. If the gradient step is large in a particular location, then that area is important to the network. If the gradient is small then it is unimportant. We can create a mask of gradients on top of the input image that indicates the networks weighted importance of parts of the image5 6.
There are several variations on this idea like Grad-CAM7 which creates a map highlighting where a network is looking for a particular class by weighting the convolutional layer activations with the average value of the gradient.
Other Methods
Activation Atlases
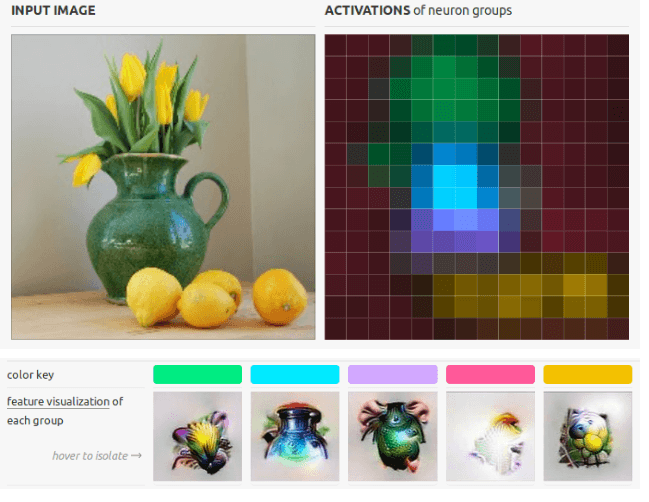
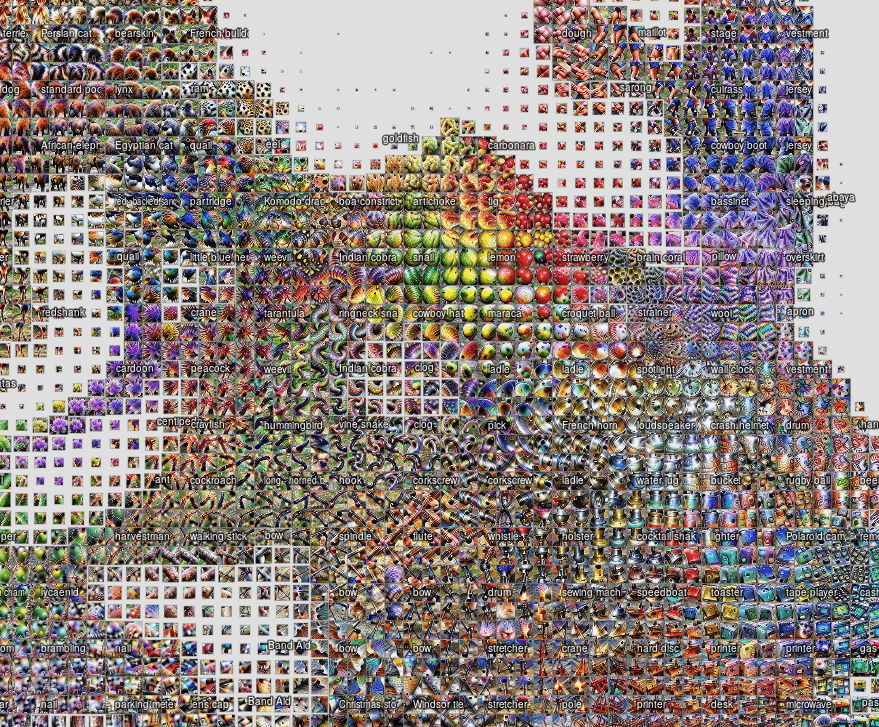
An extension of the feature visualisation technique of looking at individual activations is to sample many activations across the entire dataset and combine them into a single atlas of activations8. The atlas similarity is reduced in dimension so that it is easier to visualise and the original activation images are plotted in their lower dimensional space. This gives a more representative idea of what the network sees across the manifold of the dataset.
Adversarial Attacks
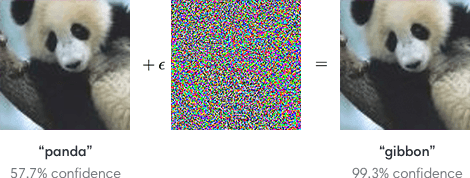
Adversarial attacks on neural networks attempt to fool the network into predicting that an input is of a different class than it actually is. The effectiveness of this technique was demonstrated with the fast gradient sign method9 where the input image could be mildly adjusted and it would make the prediction of the network completely wrong but at the same time, highly confident in it's erroneous prediction. These attacks indicated the brittleness of our networks and the authors proposed some mitigations that reduced confidence in the erroneous predictions but did not completely alleviate the problem. By interpreting such attacks, we can see how a model makes predictions and what can fool it10.
LIME
LIME11 is an interesting hybrid method: the basic premise is that by adjusting the input to the model, you will get a corresponding output change. These perturbed input-output pairs can then be used to train a different interpretable model that is predictive on that particular input. Models like random forests or Lasso regression can be used. This method indicates a level of local fidelity, where the small changes of the input should not result in large changes in the output.
Model Dependent Methods
We've set sail to the Land of Model Dependent Methods. There are many different models that can be used but these are not always as good, unfortunately, as the pure, "black box" deep networks. Some methods are so simple that you get the interpretability for free, like the linear models, others are more complicated but their own interpretations are correspondingly less obvious. Nevertheless, it is good to know about them.
Linear Models, Trees and Single-Layer Perceptrons
While these methods are not neural networks, they are reasonably interpretable as a result of their architecture. These models express their outputs as explicit combinations of the inputs - they do not have many trainable parameters that each contribute to the output in non-linear ways. A random forest, for example, can be interpreted by its tree nature - each tree in the forest has binary decisions of whether some datapoint is in one node or the other. By looking at each split in the tree, we can see how the network decides on a prediction. Tree-based methods, in particular, have several useful interpretation methods unique to them and thus are a good tool to have in your toolkit. There is a lot more on these methods that I will not get to but feel free to search around for more info.
Ensembles and Voting Architectures
While not exactly an architecture of its own, an ensemble is a method that collects the predictions of many classifiers and predicts based on those predictions. For example, the ensemble can vote that if 2 out of the 3 networks agree on a particular class, then it will be that class. Ensembles can be formed using any other kind of model. Typically, simple, easily interpretable regressions are used so that you can assign blame in the network to the main architectures and not your ensemble.
Segmentation Networks
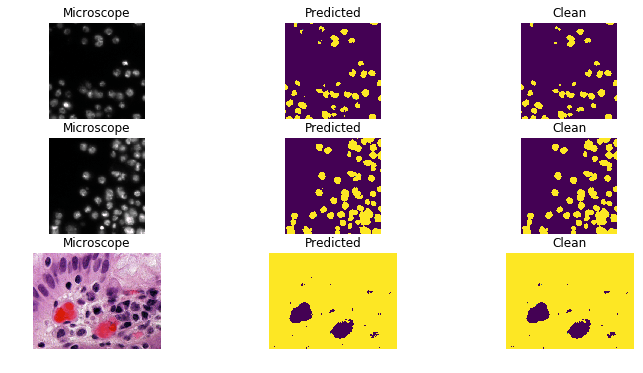
Segmenting an image is the process of predicting where a specific class is on a pixel-by-pixel basis in an input image. These mask predictions are thus self-interpreting, as the network predicts not only that the class is present in the output, but what exactly it thinks is that class. Networks like U-Net12 and Mask-RCNN13 are some examples of this architecture and provide an explanation to the prediction that they give by showing the parts of the image that they consider classified14.15
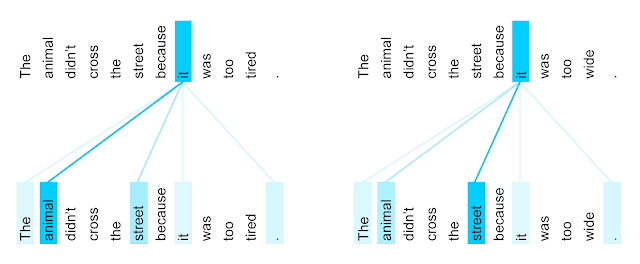
Self-Attention
Self-attention is a method of looking at your input and deciding where to concentrate your focus. The transformer architecture16 does this in several layers of self-attention, building up complex representations based on long-distance relations. The attention weights can then be looked at and plotted on top of the input in order to see where the model is "looking". 17
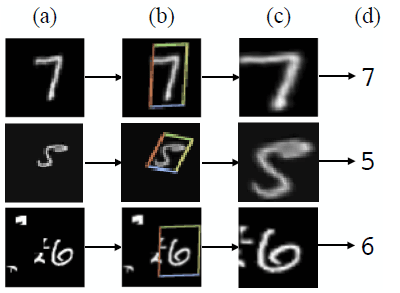
Spatial Transformer Networks
The spatial transformer18 is a technique somewhat similar to attention, but instead of focusing on the part of the input that is important, the spatial transformer crops and zooms in to that section. In this way, the spatial transformer identifies the key part of the image to look at ans cuts away all other irrelevant parts, so that the rest of the network has an easier job to classify the image.
Bayesian Neural Networks
For updating prior beliefs in the face of new evidence, the rule of Bayes is often cited. Bayesian Neural Networks19 attempt to integrate the distribution predicting power of Bayes' Rule with the arbitrary function approximation of a neural network. These networks give statistical guarantees about the probability of their predictions based on the distribution of the input data.
Conclusion
And that brings us to the end of our tour of the world of model interpretation. Interpretation is not a silver bullet and depends on the context of the model as well as the data you are putting in. It's enticing to try and create simple, intuitive explanations that us humans can understand, however, this would be misrepresenting the capabilities of a neural network. Interpretability might rather be used as an aid in understanding particular predictions within particular contexts but shouldn't be a replacement for understanding how a neural network works.
This post was meant to be biased towards applications of interpretability in vision applications. There are lots of other methods that exist for other data types. If you notice that I've left something out or made a mistake, please let me know!
Future ideas
A few final thoughts on future possibilities:
I think that model interpretability will play a large role in the usefulness of future models - particularly in critical applications like medical imaging. People will also be able to trust a model more if its predictions align with their priors. The possible downside, however, is that just because the network gives an interpretation to its prediction does not mean that that is the entire story. Anyone using a neural network should have some training on the way these algorithms work before they are deployed in the wild so that the interpretation given is not as opaque as the prediction.
Additional Resources
- Tensorflow Lucid: a library of interpretability methods
- Cleverhans: a library for adversarial attacks
- Deepchem: a library for biology related ML